Booktrackr Part VIII - Monitoring the App
08 May 2016In this post we’ll set up some lightweight monitoring and metrics infrastructure and plug that into a visualization service.
It should go without saying, but let me be clear about something. Our app doesn’t have any performance problems right now. Heck, it barely even performs. You may have heard the “premature optimization is the root of all evil” trope before, and that’s a good rule of thumb. You never want to spend time optimizing something until it’s a known, measured, demonstrable bottleneck in your application.
The reason we want to set up monitoring now is to make sure we have a good baseline to observe when certain request paths or method calls start to deviate from their normal performance characteristics. Just like with testing, CI, and automated deployment, we do that in the beginning of the project to avoid having the temptation to not do this later because “it’s too complicated.” Since our app is simple, we can add this stuff and evolve it with our app. It’s much easier to just add monitoring to new features as we build them than it is to wait until we have 25,000 lines of code and we have to figure out what and where to monitor things.
Spring Boot Metrics
Spring Boot comes with a feature called the Spring Boot Actuator that will expose a lot of your application’s metrics via an HTTP endpoint.
Here are some of the things that adding the Spring Boot Actuator makes available:
- An auto configuration report about which defaults Spring Boot did or did not apply
- A complete list of all Spring beans in the application
- All of your application’s
@RequestMappings - System monitoring info like average system load, heap size, threads, data source usage
Configuring Actuator
In order to get everything that Spring Boot Actuator provides, all you need to do is add the Spring Boot Actuator starter to build.gradle in the dependencies block: compile("org.springframework.boot:spring-boot-starter-actuator").
You can then poke around the different endpoints like /health, /metrics, /beans, or /mappings and see the information that gets returned. You may want to pretty-print it in an editor like Sublime Text or Atom so you can actually see what gets returned. Here’s what the /health endpoint returns:
{
   "status":"UP",
   "diskSpace":{
      "status":"UP",
      "total":499071844352,
      "free":414050349056,
      "threshold":10485760
   },
   "db":{
      "status":"UP",
      "database":"PostgreSQL",
      "hello":1
   }
}
That lets us know that the application is up, we have plenty of disk space available, and the database is working and the app can connect to it. Pretty cool for one line in our build script.
Dropwizard Metrics
Spring Boot’s Actuator is pretty cool, but we can do better with just a little bit more work. Dropwizard is a Java library conceptually similar to Spring Boot that doesn’t use Spring. Its metrics module, however, is pluggable and can be used with other frameworks. Metrics describes itself as
…a Java library which gives you unparalleled insight into what your code does in production.
Sounds like exactly what we want. In short, this will enable us to monitor our application with more granularity than we get with Spring Boot Actuator, collecting things like how long it takes different methods to execute.
Adding Dropwizard Metrics
Add compile("io.dropwizard.metrics:metrics-core") and compile("io.dropwizard.metrics:metrics-annotation:3.1.2") to build.gradle. Spring Boot will see Dropwizard Metrics on the classpath and automatically configure itself to both report its metrics to the Dropwizard MetricsRegistry as well as expose Dropwizard metrics via the /metrics endpoint.
Annotating Methods
If you annotate a method with com.codahale.metrics.annotation.Timed, the Dropwizard Metrics library will capture and can be configured to report metrics about the number of invocations of that method, the mean response time, the mean rate, etc.
Configuring Metrics Reporting in Spring
Ryan Tenney made a library that integrates Spring AOP with Dropwizard metrics, so go ahead and add compile("com.ryantenney.metrics:metrics-spring:3.1.3") to the classpath.
That will allow us to create a MetricsConfig in our config pacakge and configure Dropwizard to report metrics via SLF4J every minute:
@Configuration
@EnableMetrics
@Profile(value = {"dev", "prod"})
public class MetricsConfig extends MetricsConfigurerAdapter {

    private static final Logger log = LoggerFactory.getLogger(MetricsConfig.class);

    @Override
    public void configureReporters(MetricRegistry metricRegistry) {

        log.debug("Initializing Metrics Log reporting");
        registerReporter(Slf4jReporter.forRegistry(metricRegistry)
                .outputTo(LoggerFactory.getLogger("metrics"))
                .convertRatesTo(TimeUnit.SECONDS)
                .convertDurationsTo(TimeUnit.MILLISECONDS)
                .build()).start(1, TimeUnit.MINUTES);
    }
}
Note that we added an @Profile annotation so that these beans do not get configured during integration tests.
Here’s what the output looks like:
2016-05-08 10:21:48.959  INFO 31273 --- [rter-1-thread-1] metrics: type=TIMER,
name=com.ryanpmartz.booktrackr.controller.BookController.getAllBooks,
count=6, min=3.532739, max=240.06568,
mean=42.7834615291817, stddev=86.25885024225764, median=5.354532,
p75=6.425993999999999, p95=240.06568, p98=240.06568, p99=240.06568, p999=240.06568,
mean_rate=0.10653935966822069, m1=0.049260679549892786, m5=0.017358411141467578,
m15=0.006359177522778316, rate_unit=events/second, duration_unit=milliseconds
It’s not the cleanest format in the world to read, but you can see that you get info on the number of times the getAllBooks() method was called, along with the fastest (3.5ms) and slowest (240ms) times the call took.
Metrics Visualization
Ok, so now we’ve got some pretty nice reporting that didn’t take too much work to set up, which is nice. But the metrics reporting, either through the /metrics endpoint or in the application’s log, aren’t very human readable. Sure, we could format them manually or write some code to do that for use, but there are some great solutions out there for visualizing this data with off-the-shelf integrations with Dropwizard.
Hosted Graphite
One of those off-the-shelf solutions is a service called Hosted Graphite. As their name implies, they are a Graphite SaaS solution, making it easy to report metrics and create beautiful Grafana dashboards. It’s pretty easy to add a GraphiteReporter if you add the 'io.dropwizard.metrics:metrics-graphite:3.1.2' library as a compile dependency to build.gradle. In the MetricsConfig, underneath the Slf4jReporter configruation, add this:
    Graphite graphite = new Graphite(new InetSocketAddress(graphiteHost, graphitePort));

    registerReporter(GraphiteReporter.forRegistry(metricRegistry)
             .convertRatesTo(TimeUnit.SECONDS)
             .convertDurationsTo(TimeUnit.MILLISECONDS)
             .prefixedWith(hostedGraphiteApiKey)
             .build(graphite)).start(1, TimeUnit.MINUTES);
Make sure to add the graphiteHost, graphitePort, and hostedGraphiteApiKey fields to the class and inject them as Spring @Values. That’s all it takes to start shoveling Booktrackr metrics into Hosted Graphite.
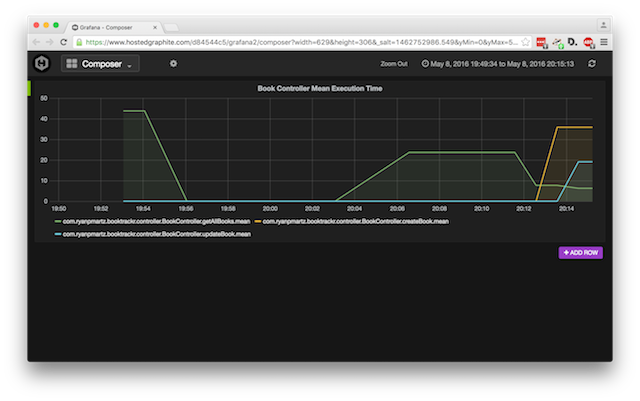
Visualizing Metrics
Graphite and Grafana are very powerful tools that you should read up on if you have the need for an application monitoring visualization solution. Here’s an example of the types of dashboards they can make it easy to create:
Wrap Up
In this installment, we added some monitoring and visualizations to Booktrackr. Although our application is still very simple, we now have some excellent infrastructure in place to record and visualize performance. This will make it much easier for us to spot when strange things are going on with our application, like a higher than usual amount of 401 or 403 response codes, which might indicate people are testing the security of our site.